Understanding Your SAT Score Report
This page explains how to read your SAT mock score report. After completing an SAT mock, you get a detailed score report. Here’s how to read it.
Where to find your score report
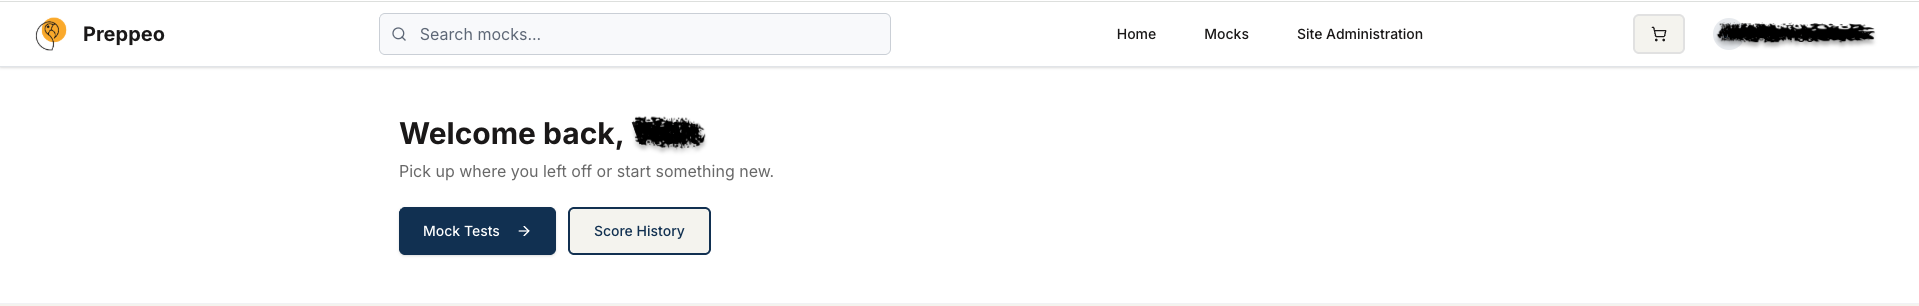
From the homepage after you log in, click Score History to open your score reports. You can also go to Mocks in the top navigation and access your history from there.
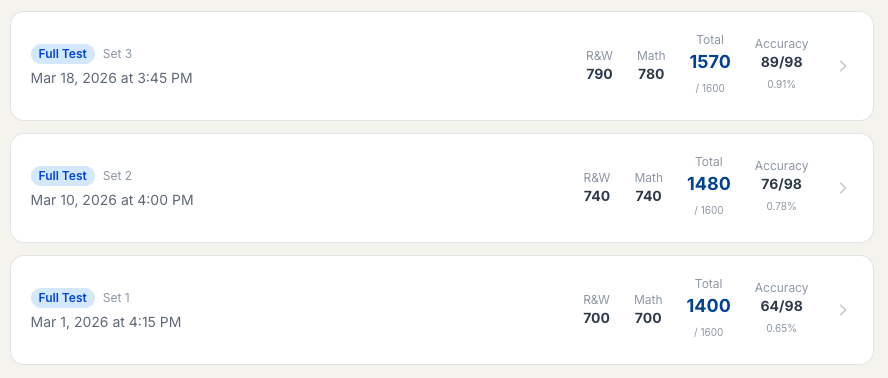
You’ll see a list of your past SAT attempts with date, set, section scores, and total. Click any entry (or the arrow on the right) to open the detailed score report for that test.
Overall Score
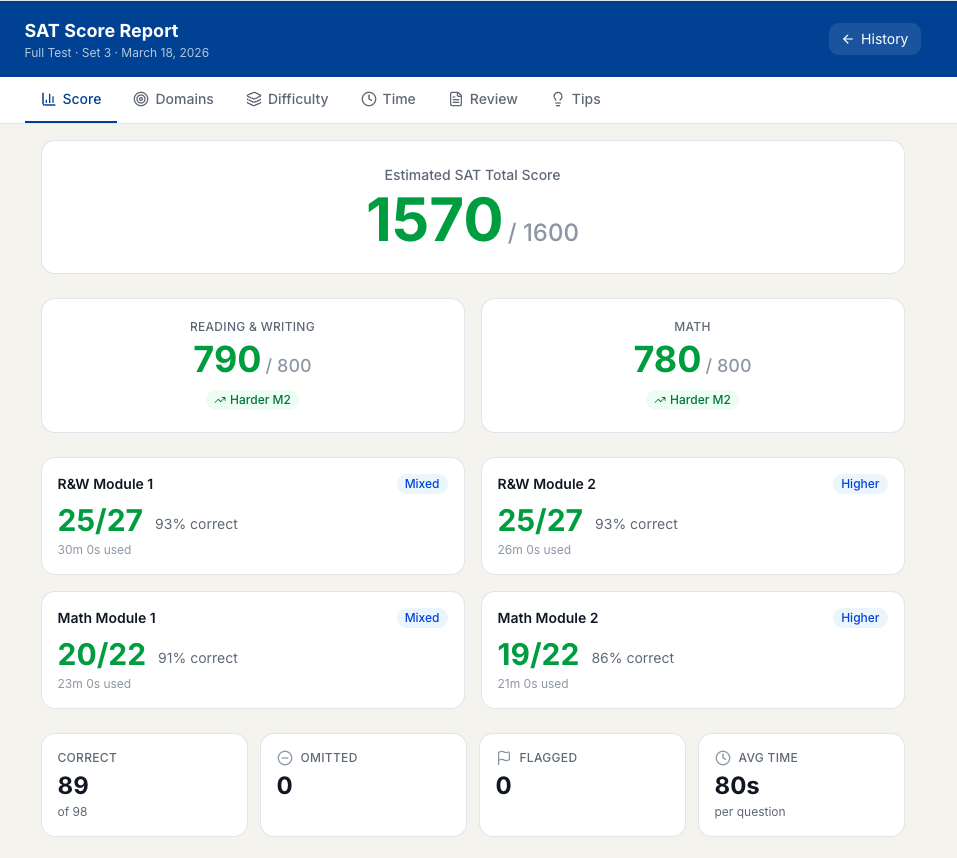
Your composite score is displayed on the 400–1600 scale (for SAT). This is broken down into two section scores: Reading & Writing and Math. You’ll also see module-wise performance (e.g. R&W Module 1 & 2, Math Module 1 & 2) and summary stats like correct, omitted, and flagged questions.
Domain Breakdown
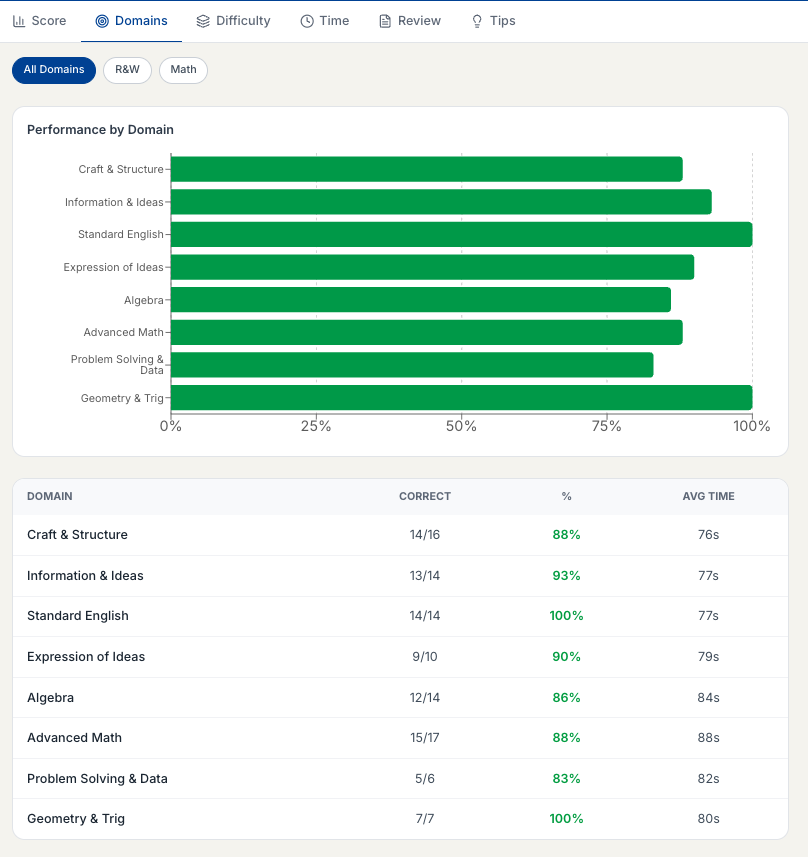
Use the Domains tab to see how you did in each content area. For SAT you’ll see Reading & Writing domains (e.g. Craft & Structure, Information & Ideas, Standard English, Expression of Ideas) and Math domains (Algebra, Advanced Math, Problem Solving & Data, Geometry & Trig). Filter by All Domains, R&W, or Math.
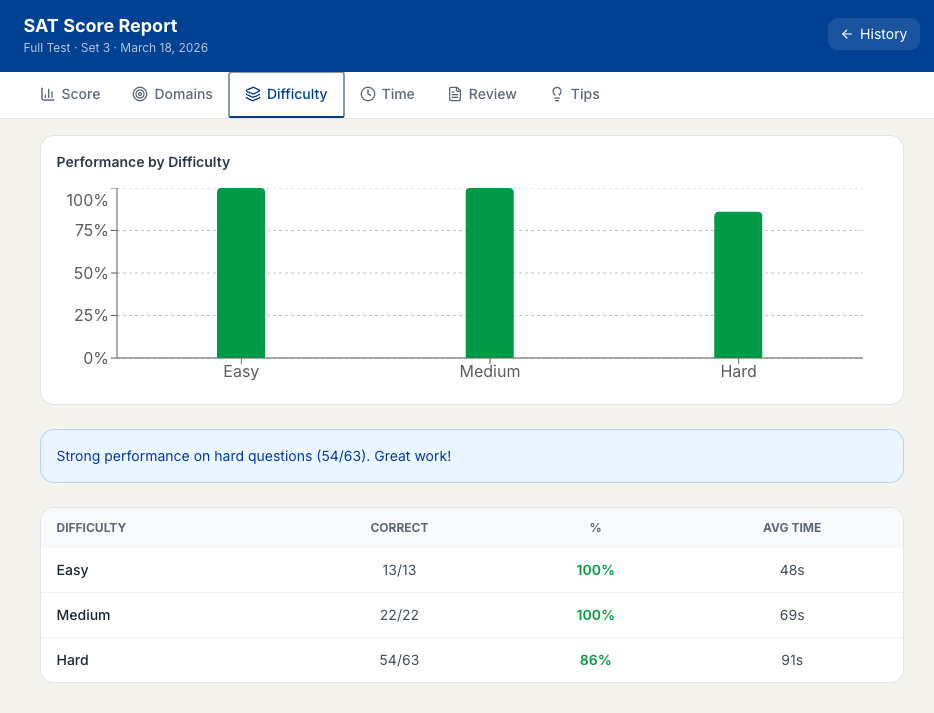
Difficulty Analysis
Use the Difficulty tab to see how you performed on Easy, Medium, and Hard questions. The chart and table show correct counts and percentages by difficulty. If you’re getting Easy questions wrong, focus on fundamentals; if you’re missing Hard ones, that’s common at mid-range scores.
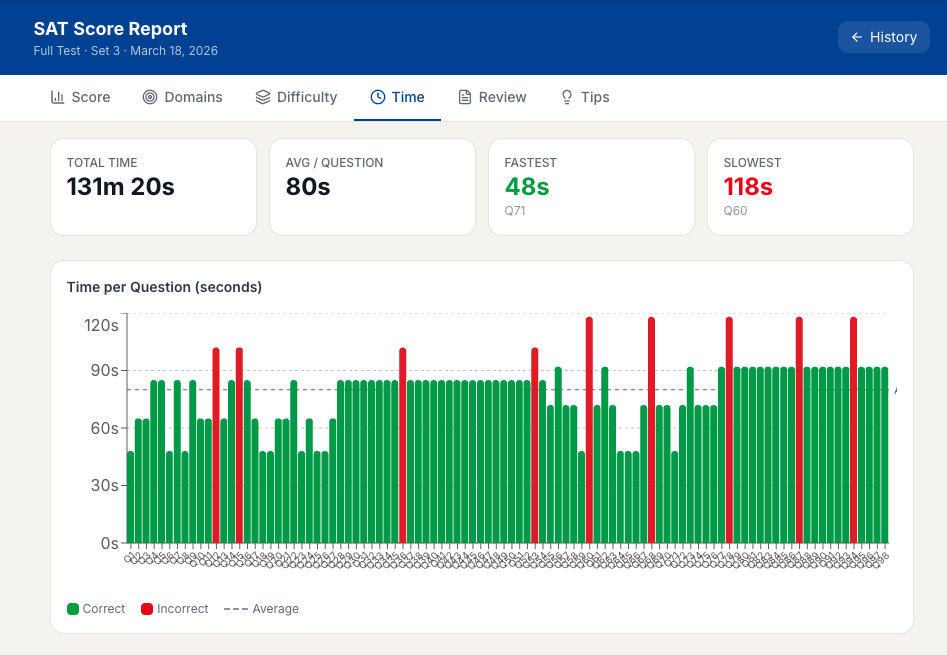
Time Analysis
Use the Time tab to see total time, average time per question, and your fastest and slowest questions. The bar chart shows time per question against the average — red bars mark incorrect answers, useful for spotting pacing issues.
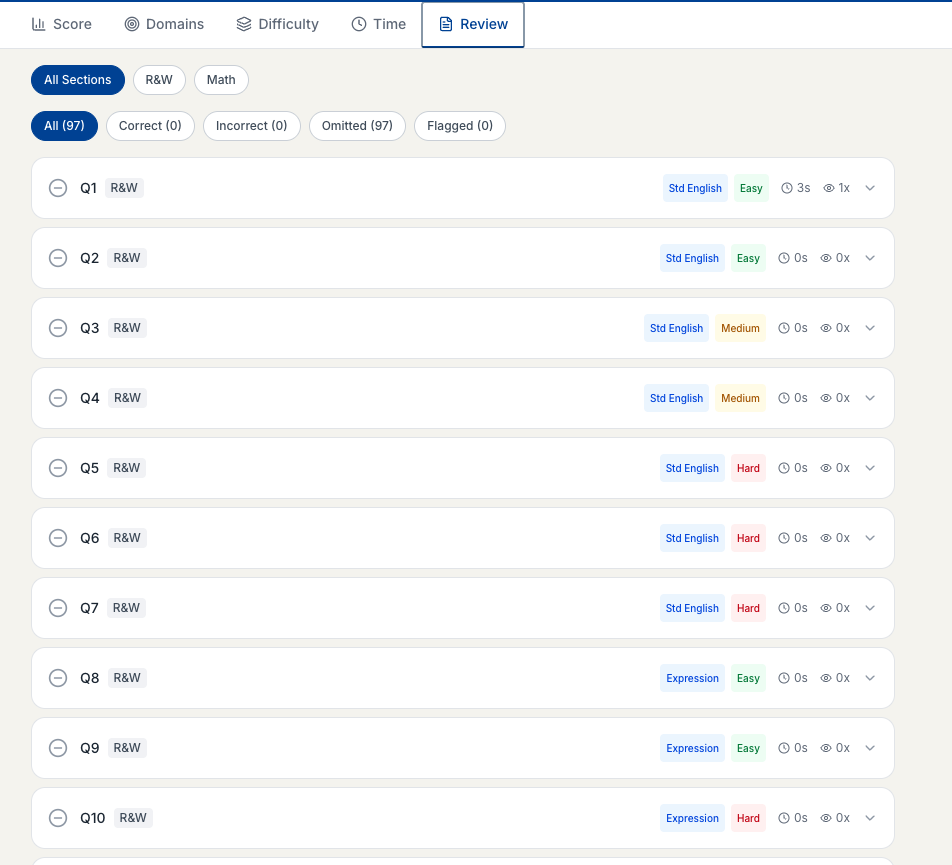
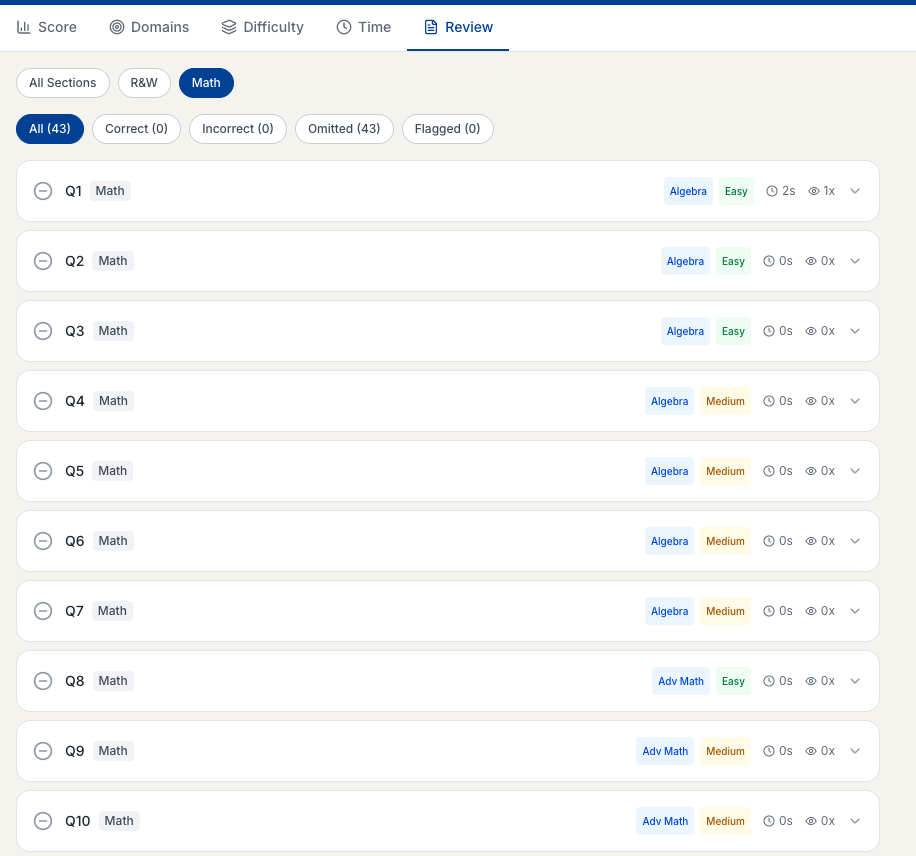
Question-Level Review
Use the Review tab to go through each question. Filter by section (All Sections, R&W, Math) and by status (Correct, Incorrect, Omitted, Flagged). Each row shows question number, concept, difficulty, time spent, and review count. Click a question to see your answer, the correct answer, the explanation, and the domain and difficulty.
Score History
Track your progress over time at preppeo.com/sat-test/history . Each mock’s score is plotted so you can see your improvement trend.
Next Steps
- Weak in a specific domain? Use Practice Mode to drill those topics.
- Want another mock? See How to Buy Mock Tokens.